Another Look At Election Years
Last week in our LPL Research blog, we took a closer look at how stocks have performed during an election year. We found that since 1940, the S&P 500 Index hasn’t been lower during an election year when an incumbent president has been up for reelection.
We’ve had many requests to look more into election years, so we thought we’d take another look at this impactful year.
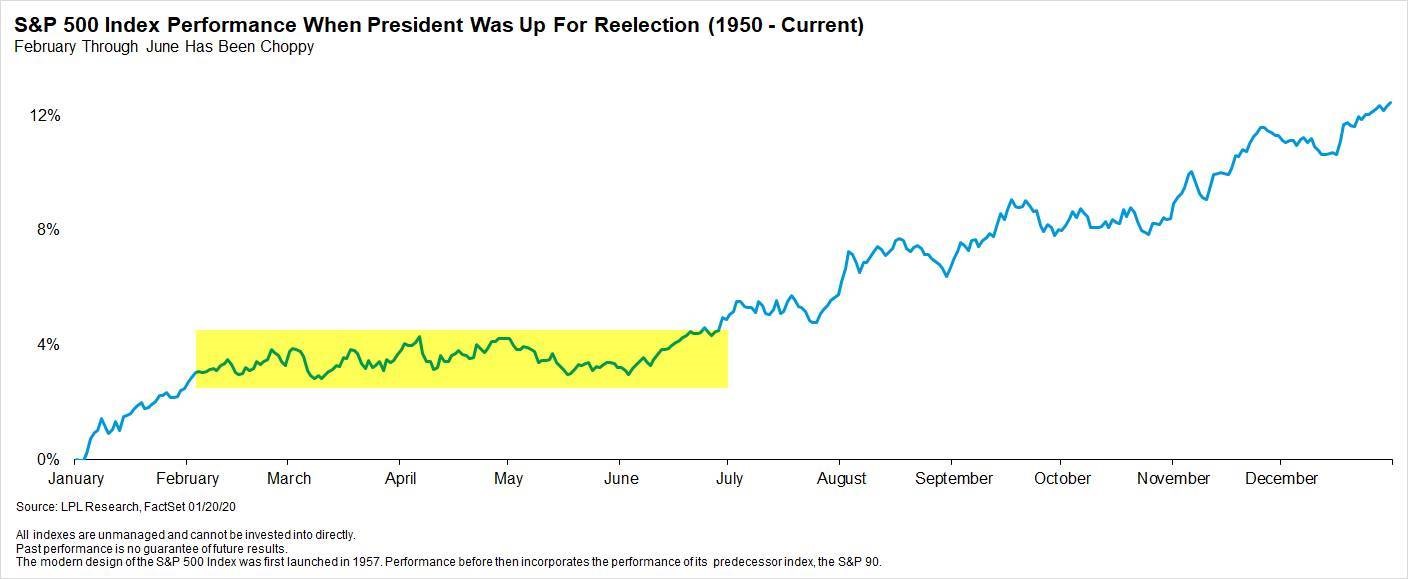
The S&P 500’s track record for reelection years has been impressive, but its average path during these years has been quite interesting, as shown in the LPL Chart of the Day. In ten reelection years since 1950, the S&P 500 on average has barely budged from February through June, before breaking out in the second half of the year.
“Stocks actually have traded in a tight range from February through June during election years, with the big rally taking place during the second half of the year,” explained LPL Financial Senior Market Strategist Ryan Detrick.
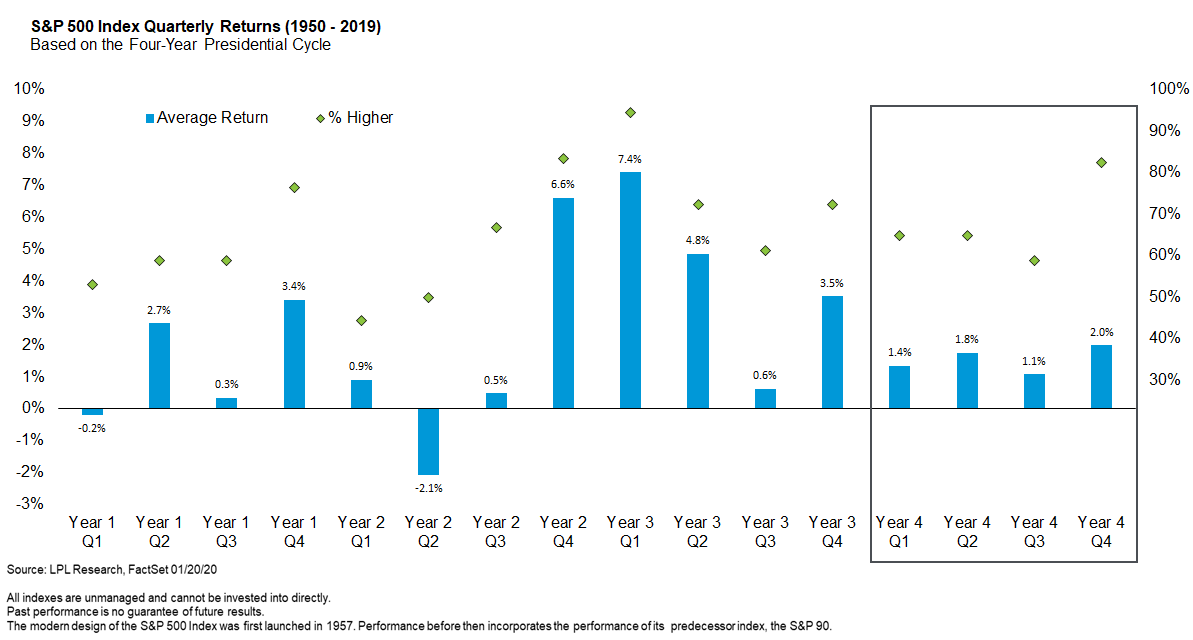
From a quarterly view, the S&P 500 has historically posted modest returns in the four quarters of an election year, but the benchmark has been higher an impressive 82% of the time in the fourth quarter of all election years. That’s one of the best track records of any quarter in the four-year presidential cycle.
For more of our investment insights, check out our Outlook 2020: Bringing Markets Into Focus.
IMPORTANT DISCLOSURES
The opinions voiced in this material are for general information only and are not intended to provide specific advice or recommendations for any individual security. To determine which investment(s) may be appropriate for you, consult your financial professional prior to investing. The economic forecasts set forth in this material may not develop as predicted.
Please read the full Outlook 2020: Bringing Markets Into Focus publication for additional description and disclosure.
All indexes are unmanaged and cannot be invested into directly. Unmanaged index returns do not reflect fees, expenses, or sales charges, Index performance is not indicative of the performance of any investment.
Investing involves risks including possible loss of principal. No investment strategy or risk management technique can guarantee return or eliminate risk in all market environments.
All performance referenced is historical and is no guarantee of future results.
This research material has been prepared by LPL Financial LLC.
Securities and advisory services offered through LPL Financial (LPL), a registered investment advisor and broker-dealer (member FINRA/SIPC).
Insurance products are offered through LPL or its licensed affiliates. To the extent you are receiving investment advice from a separately registered independent investment advisor, please note that LPL is not an affiliate of and makes no representation with respect to such entity.
If your advisor is located at a bank or credit union, please note that the bank/credit union is not registered as a broker-dealer or investment advisor. Registered representatives of LPL may also be employees of the bank/credit union. These products and services are being offered through LPL or its affiliates, which are separate entities from, and not affiliates of, the bank/credit union. Securities and insurance offered through LPL or its affiliates are:
Not insured by FDIC/NCUA or Any Other Government Agency | Not Bank/Credit Union Guaranteed | Not Bank/Credit Union Deposits or Obligations | May Lose Value
Member FINRA/SIPC
For Public Use – Tracking # 1-940942